
hAP ac同士を接続しスループット計測を実施
最初に
MikroTik hAP acのスループット計測 | fefcc.net
https://fefcc.net/archives/677
上記の記事でhAP ac1台に複数端末を接続し
ブリッジ性能を計測しましたが
今回はhAP ac 2台を2重ルータ状態にして
スループット計測を行います
テスト環境
hAP ac(RouterOS v6.42.5)
Winbox v3.16
hAP ac ルータA 192.168.88.1/24
1番ポート:未使用
2番ポート:計測PC
3番ポート:ルータBの1番ポートへ
4番ポート:未使用
5番ポート:未使用
hAP ac ルータB 192.168.87.1/24
1番ポート:ルータAの3番ポートへ
2番ポート:計測PC
3番ポート:未使用
4番ポート:未使用
5番ポート:未使用
hAP acはReset Configurationを実施しdefconf状態で
ルータB側のみ初期値のセグメントから変更済
計測PCなどは冒頭にリンクしている
スループット計測記事内で使用したのと同じです
計測結果
pingとiperf3(TCP/UDP)で計測しました
使用したiperf3のバージョンは3.1.7
ping
[root@nettest02 ~]# ping -c 10 192.168.88.199
PING 192.168.88.199 (192.168.88.199) 56(84) bytes of data.
64 bytes from 192.168.88.199: icmp_seq=1 ttl=63 time=0.288 ms
64 bytes from 192.168.88.199: icmp_seq=2 ttl=63 time=0.298 ms
64 bytes from 192.168.88.199: icmp_seq=3 ttl=63 time=0.266 ms
64 bytes from 192.168.88.199: icmp_seq=4 ttl=63 time=0.294 ms
64 bytes from 192.168.88.199: icmp_seq=5 ttl=63 time=0.310 ms
64 bytes from 192.168.88.199: icmp_seq=6 ttl=63 time=0.293 ms
64 bytes from 192.168.88.199: icmp_seq=7 ttl=63 time=0.246 ms
64 bytes from 192.168.88.199: icmp_seq=8 ttl=63 time=0.298 ms
64 bytes from 192.168.88.199: icmp_seq=9 ttl=63 time=0.266 ms
64 bytes from 192.168.88.199: icmp_seq=10 ttl=63 time=0.309 ms

--- 192.168.88.199 ping statistics ---
10 packets transmitted, 10 received, 0% packet loss, time 8999ms
rtt min/avg/max/mdev = 0.246/0.286/0.310/0.029 ms
iperf3 TCP
[root@nettest02 ~]# iperf3 -c 192.168.88.199 -i 1 -t 10
Connecting to host 192.168.88.199, port 5201
[  4] local 192.168.87.254 port 56898 connected to 192.168.88.199 port 5201
[ ID] Interval           Transfer     Bandwidth       Retr  Cwnd
[  4]   0.00-1.00   sec   111 MBytes   934 Mbits/sec    0    313 KBytes
[  4]   1.00-2.00   sec   112 MBytes   935 Mbits/sec   26   84.8 KBytes
[  4]   2.00-3.00   sec   111 MBytes   928 Mbits/sec   15    215 KBytes
[  4]   3.00-4.00   sec   111 MBytes   927 Mbits/sec   20    204 KBytes
[  4]   4.00-5.00   sec   111 MBytes   931 Mbits/sec   22    119 KBytes
[  4]   5.00-6.00   sec   111 MBytes   929 Mbits/sec   10    124 KBytes
[  4]   6.00-7.00   sec   111 MBytes   928 Mbits/sec   19    154 KBytes
[  4]   7.00-8.00   sec   111 MBytes   928 Mbits/sec   16    223 KBytes
[  4]   8.00-9.00   sec   112 MBytes   935 Mbits/sec   28    146 KBytes
[  4]   9.00-10.00  sec   111 MBytes   929 Mbits/sec   18   77.8 KBytes
- - - - - - - - - - - - - - - - - - - - - - - - -
[ ID] Interval           Transfer     Bandwidth       Retr
[  4]   0.00-10.00  sec  1.08 GBytes   931 Mbits/sec  174             sender
[  4]   0.00-10.00  sec  1.08 GBytes   929 Mbits/sec                  receiver

iperf Done.
-----------------------------------------------------------
Server listening on 5201
-----------------------------------------------------------
Accepted connection from 192.168.88.198, port 56896
[  5] local 192.168.88.199 port 5201 connected to 192.168.88.198 port 56898
[ ID] Interval           Transfer     Bandwidth
[  5]   0.00-1.00   sec   106 MBytes   891 Mbits/sec
[  5]   1.00-2.00   sec   111 MBytes   931 Mbits/sec
[  5]   2.00-3.00   sec   111 MBytes   929 Mbits/sec
[  5]   3.00-4.00   sec   111 MBytes   929 Mbits/sec
[  5]   4.00-5.00   sec   111 MBytes   931 Mbits/sec
[  5]   5.00-6.00   sec   111 MBytes   929 Mbits/sec
[  5]   6.00-7.00   sec   111 MBytes   929 Mbits/sec
[  5]   7.00-8.00   sec   111 MBytes   928 Mbits/sec
[  5]   8.00-9.00   sec   111 MBytes   932 Mbits/sec
[  5]   9.00-10.00  sec   111 MBytes   929 Mbits/sec
[  5]  10.00-10.04  sec  4.20 MBytes   938 Mbits/sec
- - - - - - - - - - - - - - - - - - - - - - - - -
[ ID] Interval           Transfer     Bandwidth
[  5]   0.00-10.04  sec  0.00 Bytes  0.00 bits/sec                  sender
[  5]   0.00-10.04  sec  1.08 GBytes   926 Mbits/sec                  receiver
iperf3 UDP 10G
[root@nettest02 ~]# iperf3 -c 192.168.88.199 -u -i 1 -t 10 -b 10G
Connecting to host 192.168.88.199, port 5201
[  4] local 192.168.87.254 port 45095 connected to 192.168.88.199 port 5201
[ ID] Interval           Transfer     Bandwidth       Total Datagrams
[  4]   0.00-1.00   sec   114 MBytes   954 Mbits/sec  82369
[  4]   1.00-2.00   sec   114 MBytes   954 Mbits/sec  82348
[  4]   2.00-3.00   sec   114 MBytes   954 Mbits/sec  82369
[  4]   3.00-4.00   sec   114 MBytes   954 Mbits/sec  82365
[  4]   4.00-5.00   sec   114 MBytes   954 Mbits/sec  82367
[  4]   5.00-6.00   sec   114 MBytes   954 Mbits/sec  82331
[  4]   6.00-7.00   sec   114 MBytes   954 Mbits/sec  82357
[  4]   7.00-8.00   sec   114 MBytes   954 Mbits/sec  82350
[  4]   8.00-9.00   sec   114 MBytes   954 Mbits/sec  82356
[  4]   9.00-10.00  sec   114 MBytes   954 Mbits/sec  82385
- - - - - - - - - - - - - - - - - - - - - - - - -
[ ID] Interval           Transfer     Bandwidth       Jitter    Lost/Total Datagrams
[  4]   0.00-10.00  sec  1.11 GBytes   954 Mbits/sec  0.013 ms  0/823584 (0%)
[  4] Sent 823584 datagrams

iperf Done.
-----------------------------------------------------------
Server listening on 5201
-----------------------------------------------------------
Accepted connection from 192.168.88.198, port 56908
[  5] local 192.168.88.199 port 5201 connected to 192.168.88.198 port 45095
[ ID] Interval           Transfer     Bandwidth       Jitter    Lost/Total Datagrams
[  5]   0.00-1.00   sec   109 MBytes   916 Mbits/sec  0.013 ms  0/79057 (0%)
[  5]   1.00-2.00   sec   114 MBytes   954 Mbits/sec  0.008 ms  0/82360 (0%)
[  5]   2.00-3.00   sec   114 MBytes   954 Mbits/sec  0.019 ms  0/82315 (0%)
[  5]   3.00-4.00   sec   114 MBytes   954 Mbits/sec  0.016 ms  0/82376 (0%)
[  5]   4.00-5.00   sec   114 MBytes   954 Mbits/sec  0.017 ms  0/82366 (0%)
[  5]   5.00-6.00   sec   114 MBytes   954 Mbits/sec  0.016 ms  0/82341 (0%)
[  5]   6.00-7.00   sec   114 MBytes   954 Mbits/sec  0.016 ms  0/82361 (0%)
[  5]   7.00-8.00   sec   114 MBytes   954 Mbits/sec  0.017 ms  0/82337 (0%)
[  5]   8.00-9.00   sec   114 MBytes   954 Mbits/sec  0.019 ms  0/82358 (0%)
[  5]   9.00-10.00  sec   114 MBytes   954 Mbits/sec  0.021 ms  0/82366 (0%)
[  5]  10.00-10.04  sec  4.62 MBytes   954 Mbits/sec  0.013 ms  0/3347 (0%)
- - - - - - - - - - - - - - - - - - - - - - - - -
[ ID] Interval           Transfer     Bandwidth       Jitter    Lost/Total Datagrams
[  5]   0.00-10.04  sec  0.00 Bytes  0.00 bits/sec  0.013 ms  0/823584 (0%)
hAP acのCPU負荷(iperf3実行時)
ルータB側
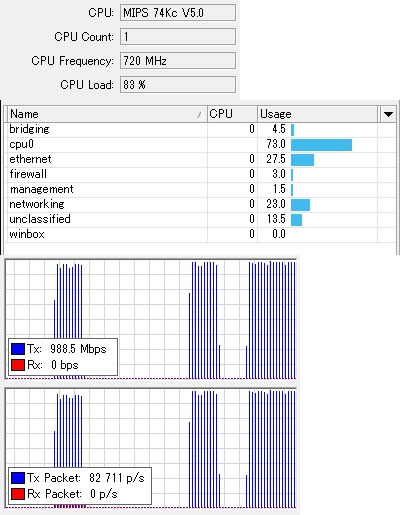
ルータA側

計測結果について
前回のhAP ac単体 同一ブリッジ内で計測した結果と比較すると
pingは平均値で0.1ms増加
iperf3 TCPはRetr値が確認できるものの速度低下はなし
iperf3 UDPは10Gに関わらずロスは0%で速度低下もなし
CPU負荷は送信側のルータBの方だけ負荷がかかってる状態だが
85%以下をキープできているので問題なし
ルータA側はほとんど負荷がかかっておらず余裕の状態
最後に
今回紹介しているMikroTik hAP acの基本情報や入手元については
こちらの記事をご覧ください
MikroTik hAP acを開封 | fefcc.net
https://fefcc.net/archives/552

コメント